October 8, 2026Position Reconstruction
How to Reconstruct a Closed Futures Position From Exchange Data
Follow executions from the first entry to the final close, then reconcile trading fees and funding to understand a futures position's complete result.
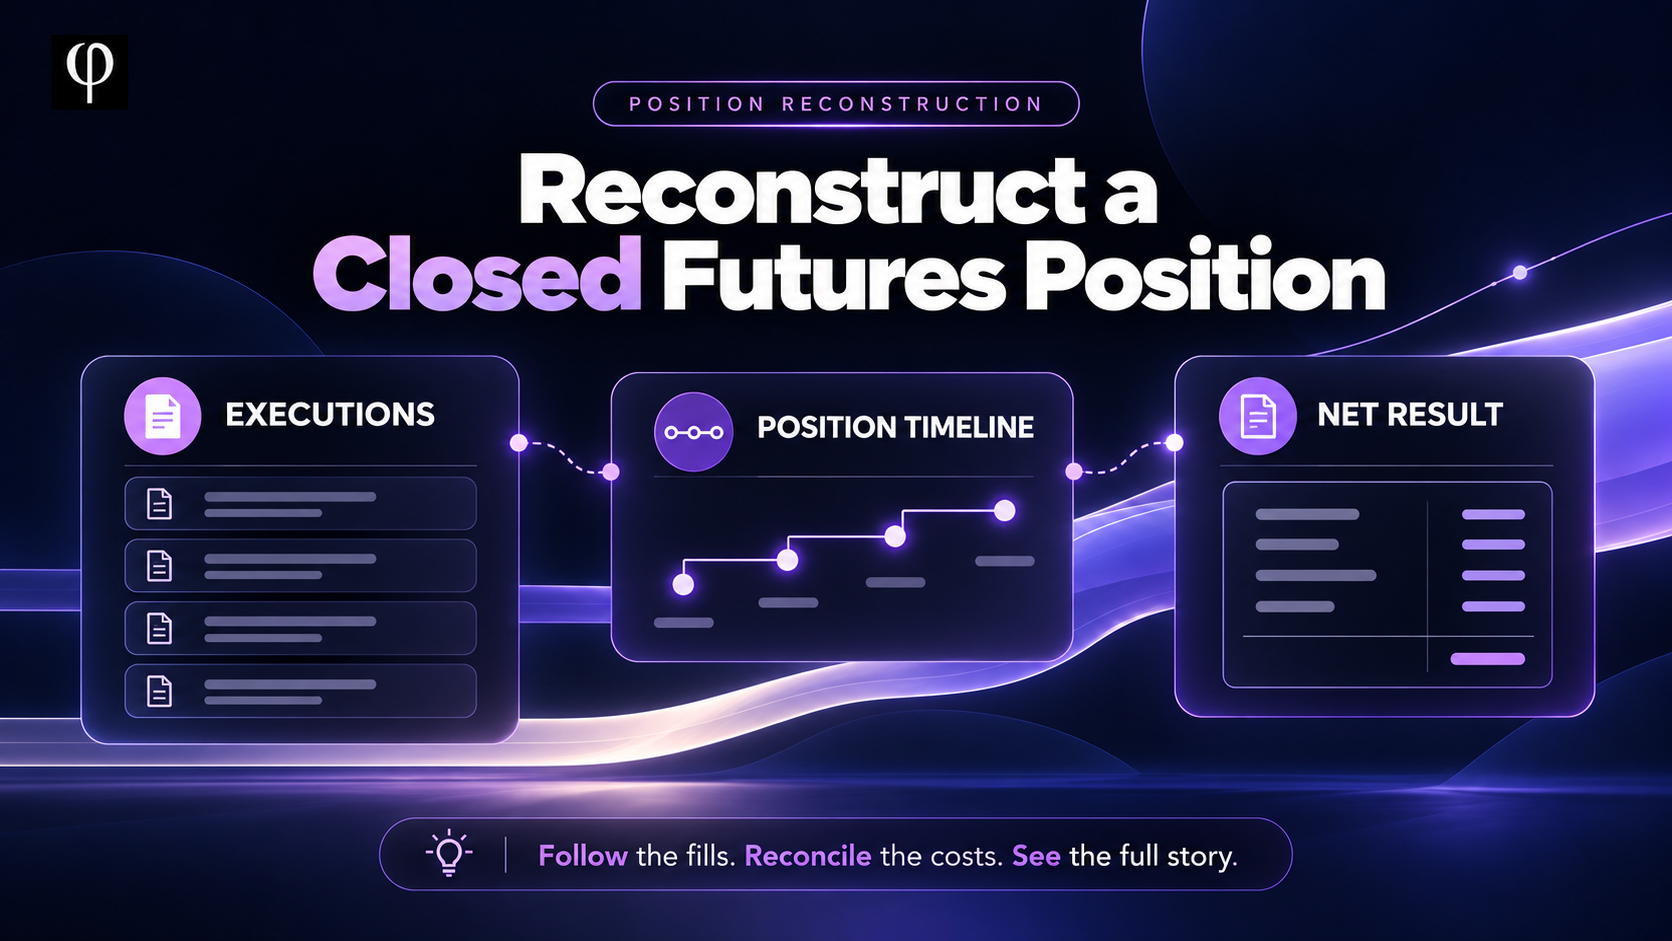
You closed a futures position and the exchange shows a final P&L number.
But your history contains several buys, two sells, trading fees, and a funding payment. The entry you remember does not match the average entry shown later. One closing fill made money. Another lost money.
Which records belong to the same position? What happened between the first entry and the final exit? And does the final number include all the costs?
To reconstruct a closed futures position, you need to follow how its quantity changed, then reconcile the money attached to that lifecycle. A final entry price and exit price cannot explain every decision along the way.
Quick Answer
Start with executed trades, group them by account, contract, and position side, and arrange them in time order. Track the position from a confirmed zero balance through each opening, add, partial close, and final close back to zero.
Then reconcile the closing results with trading fees and funding records. Check whether the exchange's P&L figure already includes those costs before subtracting anything.
A useful reconstruction answers four questions:
- What actually filled?
- How did the open quantity change?
- Which cash flows belong to this lifecycle?
- What information is still missing?
If the first opening fill is unavailable, or the account history does not cover the whole period, label the reconstruction incomplete. A clean-looking timeline is only useful when its boundaries are supported by the records.
1. Define the Position You Are Reconstructing
For this guide, a position lifecycle begins when a particular contract and side moves from zero exposure to an open quantity. It ends when that quantity returns to zero.
This gives you a practical unit for review. Several orders can belong to one lifecycle. One order can also produce several execution records.
Record the exchange, account or subaccount, contract, settlement asset, position mode, and side before grouping anything. Two BTC contracts on different exchanges are separate records. A USDT-settled perpetual and an inverse BTC-settled contract require different calculations.
If you opened a position, closed it completely, then opened another five minutes later, those are two lifecycles under this definition. Their shared symbol does not make them one continuous position.
You can later group both into a trading idea for your own review. Keep that interpretation separate from the underlying exposure timeline.
2. Gather Three Types of Exchange Records
Collect execution history, account cash flows, and any available order or position context.
Execution history tells you the filled quantity and price. Cash flows help explain fees, funding, and other balance movements. Order and position context can help identify the relevant side, protection orders, and settings.
For Binance USDⓈ-M futures, the official Account Trade List documentation lists execution-level identifiers, quantity, price, commission, realized P&L, time, and position side.
The separate Income History documentation distinguishes categories such as realized P&L, commission, funding, and transfers.
Preserve the original files alongside your working sheet. Write down which account, date range, and filters produced each export. This makes it possible to trace a confusing total back to its source instead of repeatedly changing formulas until the result looks plausible.
3. Check the History Window Before Calculating
A successful export or API response does not prove you have the full position.
As checked on October 9, 2026, Binance's Account Trade List specifies a maximum seven-day time span per request and a three-month query history. Income History also specifies three months of available history. These limits describe those endpoints; they are not a promise about every exchange download facility.
Bybit's Get Trade History documentation specifies seven-day request windows and cursor pagination. Continue through every page for each required window.
If the position opened before the available history begins, look for an earlier saved export or another supported account-history download. Do not treat the oldest returned fill as the opening merely because it is the first row you can see.
Keep a coverage note: earliest available timestamp, latest timestamp, missing windows, and whether the beginning and end of the position are confirmed. Check current exchange documentation whenever you repeat this process; retrieval rules can change.
4. Use Executions to Build the Timeline
An order describes an instruction. An execution records a fill.
An order for 0.10 BTC might fill in three parts at different prices. A canceled order might have no fills, or it might have filled partially before cancellation. Counting its requested quantity as traded quantity would create exposure that never existed.
Keep one row per execution in your working ledger. Preserve the execution ID, order ID, timestamp, side, filled quantity, execution price, fee amount, and fee asset when available.
Use order records as supporting context. They can help explain how the fill was requested, but a stop trigger or limit price is not automatically the price at which the position closed.
If you summarize several fills into one display row, retain a link to their original rows. Your summary should remain auditable even when the article-style timeline is simplified.
5. Normalize Time, Units, and Identifiers
Use a consistent timezone, such as UTC, for the working ledger. Keep the original timestamp too. A funding event displayed on one local calendar day can fall on a different UTC day without being an extra payment.
Sort executions chronologically. If several records share a timestamp, preserve the exchange's identifiers and ordering guidance rather than relying on the order of rows in a spreadsheet.
Deduplicate using identifiers within their account and instrument scope. Do not remove rows just because their price, quantity, and timestamp match: two legitimate fills can look identical.
Keep BTC quantities separate from USDT amounts and contract counts. Use full available numeric precision during calculations, then round the displayed result. Repeatedly rounding the average entry after each fill can create a reconciliation difference that grows with the number of executions.
6. Separate Long and Short Exposure
In a simple one-way position, buys increase signed quantity and sells decrease it. Whether an execution opens or closes exposure depends on the quantity immediately before that execution.
In hedge mode, long and short exposure can coexist. Group records using the exchange's position-side information and the relevant order or position records. Do not net every buy and sell for a symbol into one bucket.
For example, a buy could increase a long or close a short. Its direction alone does not identify the lifecycle.
If your export lacks enough side information, mark the grouping uncertain and obtain additional records. A timeline that combines independent long and short positions can falsely show a position reaching zero, while both sides actually remained open.
7. Build a Running Quantity Ledger
For a confirmed long-only lifecycle, the first pass can be simple:
Quantity after fill = quantity before fill + opening quantity − closing quantity
Start at a known zero. Carry the resulting quantity into the next row. Mark increases, reductions, and the final return to zero.
This ledger catches many mistakes before you touch P&L. If a supposed close exceeds the remaining quantity, investigate missing fills, incorrect side grouping, or a reversal.
A reduction that leaves quantity above zero is a partial close. It realizes a result on the closed portion while leaving another portion exposed. That distinction is easy to lose when reviewing only the final exit price.
For the effect of an increase on the open position, see What Happens When You Add to a Futures Position?.
8. Follow a Complete Worked Example
Consider an illustrative BTCUSDT long with four filled changes. Assume a linear USDT-settled contract, average-cost accounting for this example, no reversal, and no settlement adjustment during the lifecycle.
Event            Executed change          Open BTC after fill
Open             Buy 0.10 at 60,000       0.10
Add              Buy 0.05 at 58,000       0.15
Partial close    Sell 0.06 at 61,000      0.09
Final close      Sell 0.09 at 59,000      0.00
The two buys and two sells belong to one lifecycle because exposure stays open between them and returns to zero only after the final sell.
The largest quantity was 0.15 BTC. The position began smaller and finished with a smaller remaining portion. Calling it simply “a 0.15 BTC trade” would hide those changes.
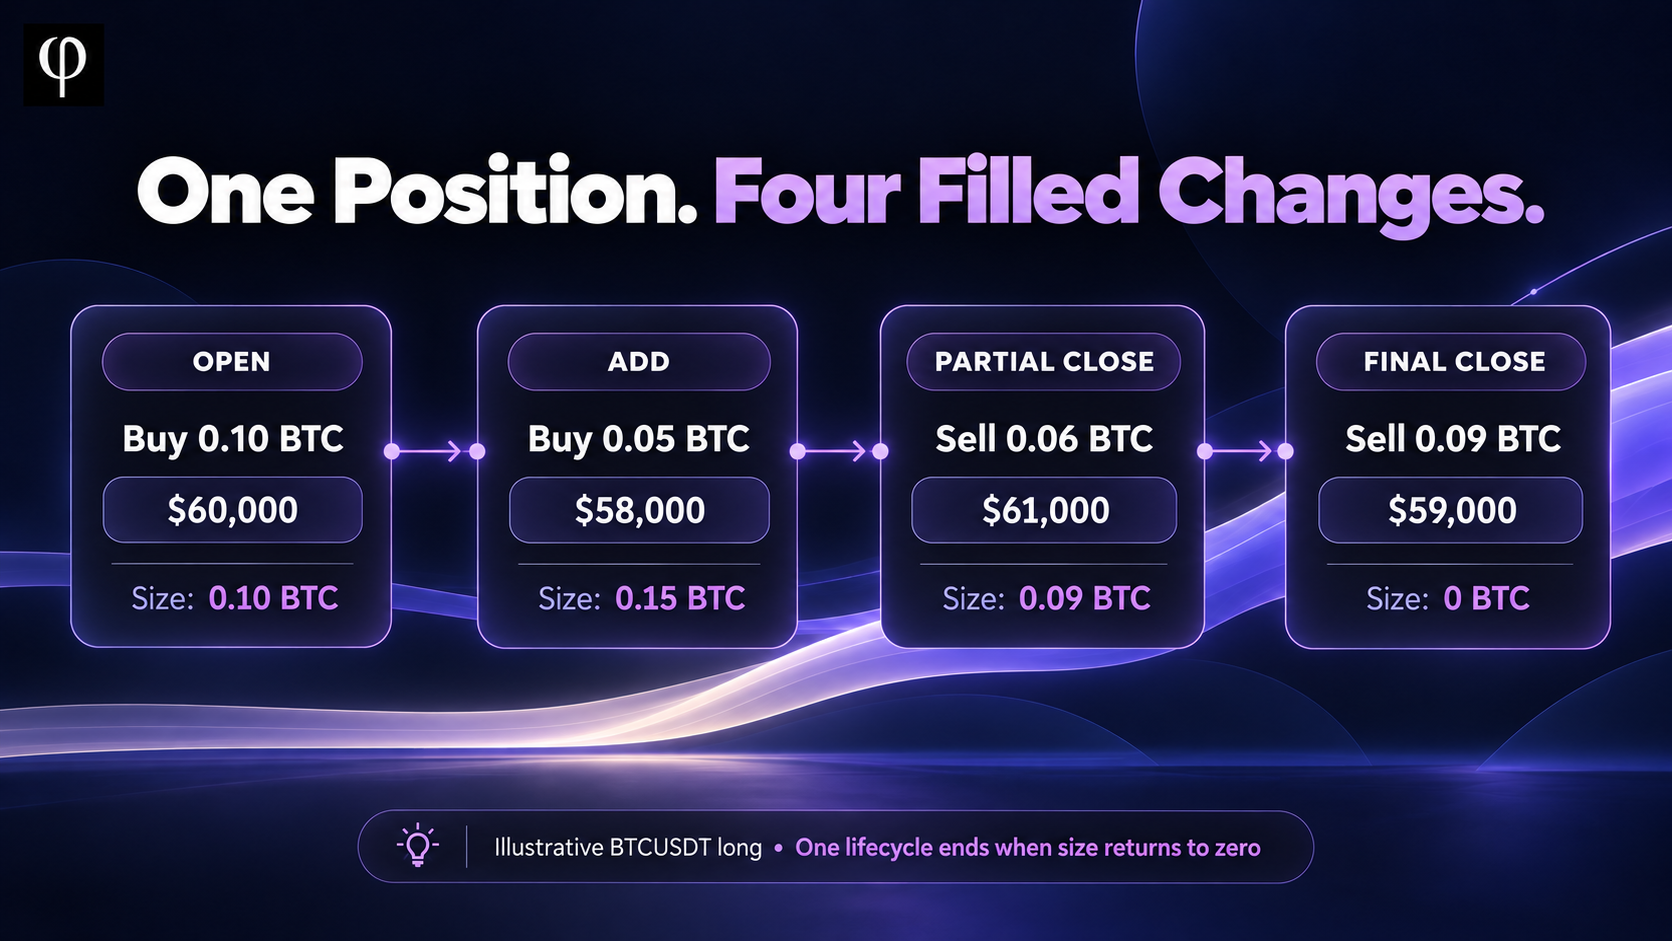
Illustrative execution timeline. Each card shows the position size after its fill.
9. Recalculate Average Entry After an Add
In this example, adding at a different price changes the quantity-weighted average entry:
Opening value = 0.10 × 60,000 = 6,000 USDT
Added value   = 0.05 × 58,000 = 2,900 USDT

Average entry = (6,000 + 2,900) ÷ 0.15
              = 59,333.3333... USDT
The lower average entry does not erase the original fill. It summarizes the combined open quantity under this accounting model.
Bybit's official USDT contract P&L guide explains quantity-weighted average entry and the role of trading and funding costs in the closed result.
Use the exchange's recorded values and contract rules as your reconciliation reference. This linear example should not be applied unchanged to inverse contracts or products with different settlement behavior. A spreadsheet formula is a useful explanation, but an unexplained difference from the exchange still needs investigation.
10. Calculate Each Closing Portion
For the average-cost long example, the gross result on each close is its quantity multiplied by exit price minus average entry.
Partial close:
0.06 × (61,000 − 59,333.3333...) = +100 USDT

Final close:
0.09 × (59,000 − 59,333.3333...) = −30 USDT

Total gross position P&L = 100 − 30 = +70 USDT
The partial close reduces the open quantity to 0.09 BTC. In this simple model, it leaves the average entry of the remaining quantity unchanged.
The last exit was below average entry, yet the complete lifecycle produced positive gross P&L. A review based only on that last exit would give the wrong explanation.
An independent cash-value check gives the same answer: all closing proceeds total 8,970 USDT, compared with 8,900 USDT of opening value. Their difference is 70 USDT before costs. These are contract-value calculations, not the amount of margin deposited.
11. Reconcile Fees and Funding Once
Now assume the records show 12 USDT of trading fees paid across the entire lifecycle and a net 8 USDT funding payment. These are illustrative ledger totals, not an advertised exchange fee rate.
Gross position P&L      +70 USDT
Trading fees paid      −12 USDT
Net funding paid        −8 USDT
--------------------------------
Net lifecycle result   +50 USDT
Use actual amounts and their currencies, rather than estimating every fill using today's fee tier. A rebate or funding receipt has a different sign from a payment.
Before subtracting costs, define the starting P&L field. Some displayed closed or realized figures already include fees and funding. Bybit's USDT guide describes cost allocation for partial closes, so subtracting those costs again from an already net figure would understate the result.
You can reconcile from gross results plus separate cash flows, or from a documented net result. Avoid combining both approaches into one total.
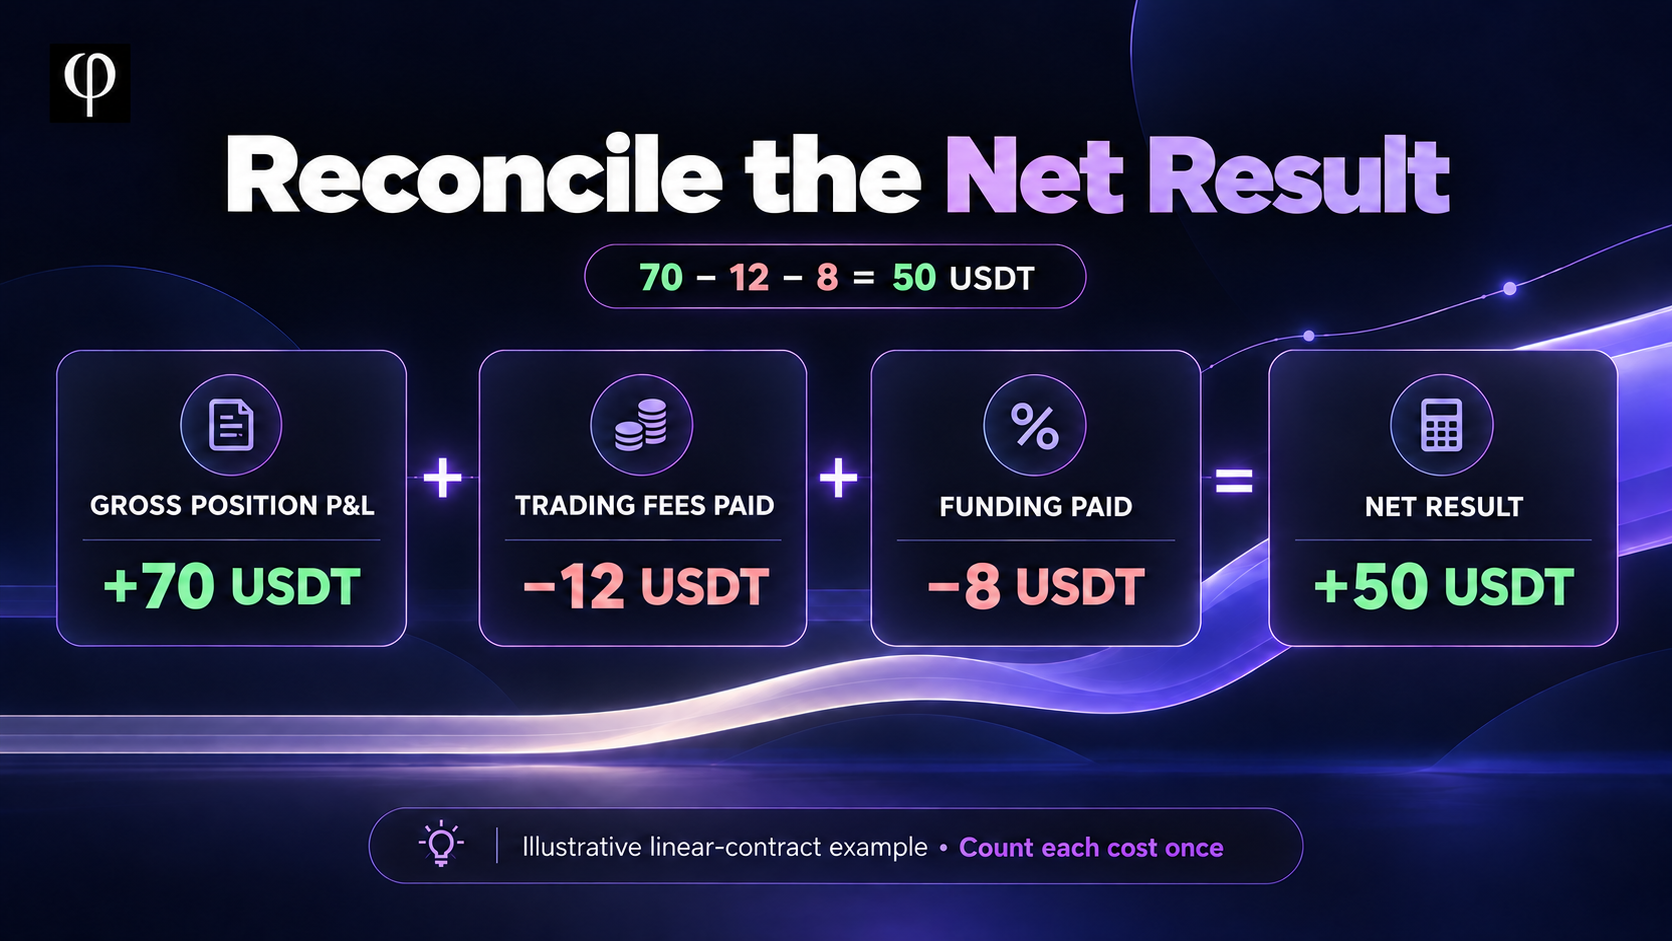
All amounts are illustrative. This reconciliation starts with gross position P&L.
12. Match Cash Flows Without Guessing
Use shared trade identifiers where available to connect commissions or realized results to executions. Keep transaction categories and identifiers so you can detect overlap between exports.
Funding may require matching the instrument, settlement time, and exposure present at that time. Do not attach every same-symbol funding row to every position you reviewed that day.
If simultaneous sides or incomplete records prevent a reliable allocation, retain the cash flow at account level and explain the uncertainty. An arbitrary split produces a precise number with weak support.
For more context, read Where Did My Futures Funding Fee Go?. Funding can explain a difference between the result of closing executions and the money ultimately retained.
13. Treat Reversals and Exceptional Closures Separately
In one-way mode, an execution can cross through zero. Suppose you hold a 0.09 BTC long and sell 0.12 BTC. Under a simple signed-quantity interpretation, 0.09 closes the long and the remaining 0.03 opens a short.
Split the lifecycle at zero while preserving the original execution reference. Allocate costs using a documented rule and identify any approximation.
Liquidation, delivery settlement, corrections, or other exchange-specific events may need additional records. Do not force them into an ordinary manual close merely because quantity ended at zero.
Likewise, a protective order is not evidence of a completed protective exit. Confirm the executions and available order context before describing why the position closed.
14. Separate Position Results From Account Changes
A position can be fully reconciled while the account balance still moves by a different amount.
Other positions, transfers, rebates, adjustments, and cash flows outside the selected lifecycle can affect the account. Depositing collateral or transferring funds does not become a trading profit simply because it occurred while this position was open.
Keep one ledger for the selected position result and another for the broader account reconciliation. Explain the connection without treating the two totals as interchangeable.
This distinction also matters in shared collateral arrangements. The environment around a position can change even without a new fill in that position. See How Much of Your Account Is at Risk Across Open Futures Positions? for the wider exposure context.
15. Preserve What the Records Cannot Tell You
Executions can establish when size changed. They do not necessarily establish the complete history of leverage settings, margin changes, or stop-loss amendments.
A current leverage value should not be copied backward across the whole lifecycle unless historical records support it. The same applies to a current stop price or margin mode.
Even a confirmed protective order does not tell you the trader's intended risk budget. That requires a contemporaneous plan or another reliable record.
Use three labels in your review: confirmed, calculated under stated assumptions, and unavailable. Keep them visible beside the timeline. This prevents a reconstructed history from quietly turning missing information into facts.
16. Reconcile Before Interpreting Performance
Compare total executed opening and closing quantities, gross closing results, fee totals by asset, and funding totals against the exchange records.
If a number differs, investigate duplicates, missing pages, incomplete boundaries, side grouping, settlement currency, and rounding before drawing conclusions about performance.
Bybit provides a separate Closed PnL endpoint that can serve as another comparison source. Establish what its returned records represent before assuming one record equals your entire reconstructed lifecycle.
For a broader P&L mismatch, see Why Is My Futures P&L Negative When My Closed Trades Are Profitable?.
Once the ledger reconciles, you can ask whether the add increased exposure beyond your plan, whether the partial close changed the outcome, and which costs mattered most. Those interpretations become more useful when they refer to an established sequence of events.
A Better Question to Ask
Instead of reviewing only “Did I close above my entry?”, ask:
What happened to my exposure from the first fill to the last, and which recorded cash flows explain the final result?
That question works even when a position has several entries, several exits, or a final close that looks misleading on its own. It also leaves room to say that part of the history is unavailable.
The Bottom Line
To reconstruct a closed futures position, establish its boundaries, follow filled quantity through every change, and reconcile the closing results with the correct costs.
In our example, four filled changes produced 70 USDT of gross profit and 50 USDT after the stated fees and funding. The final exit alone could not explain that outcome.
Keep the original records, state the accounting assumptions, and make missing information visible. The goal is a history you can inspect and explain.
See the Full Story
Fibonomy is a read-only Trading Clarity Platform built around understanding positions and their surrounding account context. It does not execute trades or provide trading signals.
Explore the product preview to see how position context can support a more complete review. This guide does not promise that connecting an account retrieves every historical exchange record; available coverage depends on the records and supported product behavior.
See the full story in Fibonomy.
This article is educational and is not financial advice. All numerical examples are illustrative. Contract rules, accounting definitions, history coverage, and exchange interfaces can differ and change.
Official Sources
- Binance USDⓈ-M Account Trade List
- Binance USDⓈ-M Income History
- Bybit Get Trade History
- Bybit Get Closed PnL
- Bybit USDT Contract P&L Calculations
Sources checked October 9, 2026.