October 15, 2026Position Reconstruction
Why Entry and Exit Price Don't Tell the Full Story of a Futures Position
Entry and exit prices summarize a futures result. See how quantity, partial closes, costs and historical context reveal what those two fields leave out.
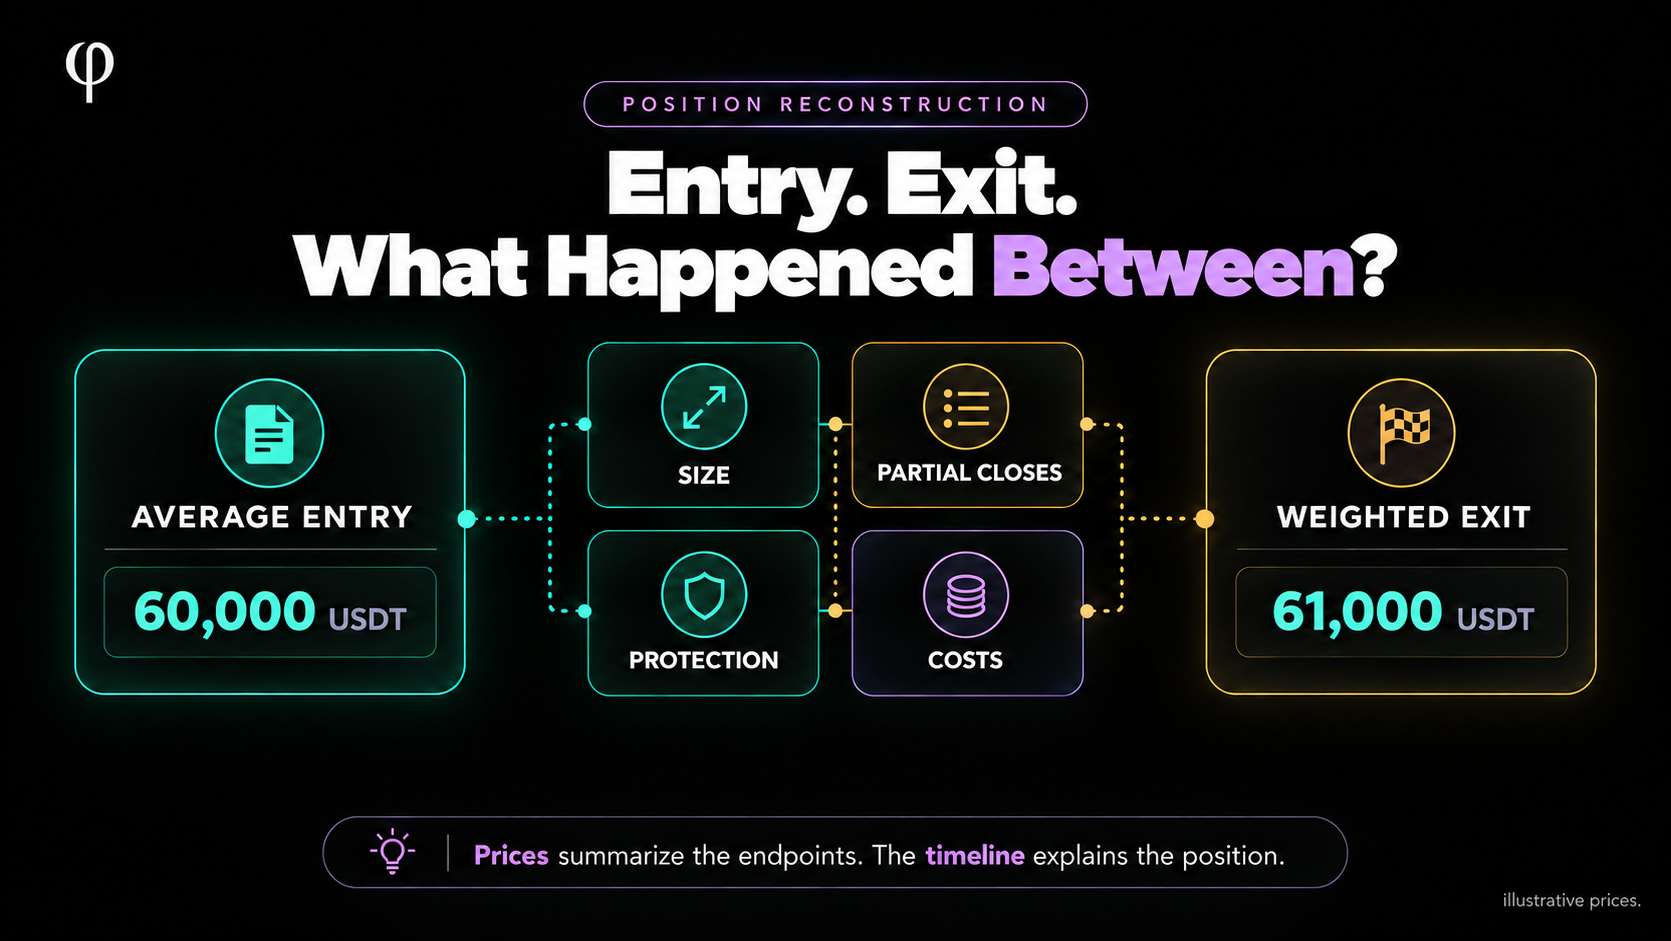
You bought Bitcoin futures, added to the position, took some profit, and eventually closed the rest near your entry.
Looking only at the last exit, the trade seems almost flat. Looking at a summary with an average exit price, it seems profitable. Neither view tells you how long you carried the larger size, what protection was in place, or what the position left after costs.
Entry and exit prices are useful. The problem is asking two price fields to explain an entire period of changing exposure.
To understand a futures position, start by defining what those prices represent. Then connect them to quantity, the sequence of executions, costs, and the historical context you can actually support.
Quick Answer
Entry and exit prices can help calculate gross P&L when you also know the contract, direction, quantity, and the correct meaning of each price. For a simple linear long with unchanged size, gross P&L is quantity multiplied by exit minus entry.
They do not, by themselves, establish the position's changing size, partial closes, holding period, protection, net costs, or relationship to the rest of the account.
A properly calculated average entry and weighted exit can summarize the gross result of a fully closed linear lifecycle. That calculation still does not reveal the route to the result.
The useful review has two parts: reconcile the outcome, then inspect the supported sequence of events that produced it.
1. When Entry and Exit Prices Are Enough
Consider a linear USDT-settled BTCUSDT long opened with one fill and closed with one fill, without any change in quantity.
Quantity:       0.10 BTC
Entry:          60,000 USDT
Exit:           61,000 USDT

Gross P&L = 0.10 × (61,000 − 60,000)
          = +100 USDT
Those inputs explain the gross price result under the stated assumptions. They do not yet explain net proceeds or whether the position followed a plan.
The distinction matters: a price-based calculation can be correct and still answer only part of the review question. There is no need to discard a valid summary to recognize its limits.
Use the correct contract model. Inverse contracts have different formulas and settlement conventions, as described in Bybit's official inverse-contract P&L guide. This article's examples use linear USDT-settled contracts throughout.
2. Which Entry and Which Exit Are You Reading?
A price labeled “entry” might be the first fill, the average entry of the remaining open position, or a summary of all opening executions. Those are different quantities of information.
Likewise, “exit” might describe the latest closing fill, a particular closing order, or a quantity-weighted average across every reduction in a completed lifecycle.
Before comparing two reports, establish their definitions. Bybit's official Closed PnL API documentation includes fields for closed size, average entry and exit, and order identifiers. Check what each returned record represents rather than assuming it is always your whole position.
A valid order-level summary can become misleading when you interpret it as a lifecycle-level summary. The calculation has not necessarily failed; the unit of explanation may have changed.
3. A Final Exit at Entry Can Hide Earlier Profit
Consider a second illustrative BTCUSDT long, Position B. Assume a known zero starting quantity, no reversal, and no settlement adjustment during this lifecycle.
Event            Execution                 Open BTC afterward
Open             Buy 0.10 at 60,000         0.10
Add              Buy 0.20 at 60,000         0.30
Partial close    Sell 0.20 at 61,500        0.10
Final close      Sell 0.10 at 60,000        0.00
All opening executions are at the same price, so the average entry stays at 60,000 USDT. The partial close realizes 300 USDT of gross profit. The final close adds zero gross price P&L.
Partial close: 0.20 × (61,500 − 60,000) = +300 USDT
Final close:   0.10 × (60,000 − 60,000) =    0 USDT

Total gross position P&L = +300 USDT
Calling this a flat position because the last exit matched entry would ignore the earlier closing portion. Calling the last portion flat is accurate; applying that description to the whole lifecycle is not.
4. The Weighted Exit Summarizes All Closing Quantity
For Position B, calculate the weighted exit using both closing executions and their actual quantities:
Weighted exit = (0.20 × 61,500 + 0.10 × 60,000) ÷ 0.30
              = (12,300 + 6,000) ÷ 0.30
              = 61,000 USDT
The weighted exit of 61,000 and final exit of 60,000 are both correct descriptions of different things. The first summarizes all closed quantity. The second records the price of the final closing portion.
A plain arithmetic average of 61,500 and 60,000 would be 60,750. It would give both fills equal weight despite their different quantities, producing an unsuitable summary for this calculation.
Preserve the underlying fills when using an average. Bybit's execution documentation distinguishes execution price and quantity and notes that an order can have several fills. Requested order prices should not replace the prices that actually executed.
5. Same Average Prices Can Produce Different Money Results
Compare the simple position from Section 1, Position A, with Position B:
| Summary field | Position A | Position B |
|---|---|---|
| Average opening price | 60,000 USDT | 60,000 USDT |
| Weighted exit across all closes | 61,000 USDT | 61,000 USDT |
| Total quantity opened and later closed | 0.10 BTC | 0.30 BTC |
| Gross position P&L | +100 USDT | +300 USDT |
The price difference is identical. The monetary result differs because the completed quantity differs.
The two price fields alone cannot establish the gross amount. Once the correct quantity and assumptions are included, the summary calculation agrees with the individual closes.
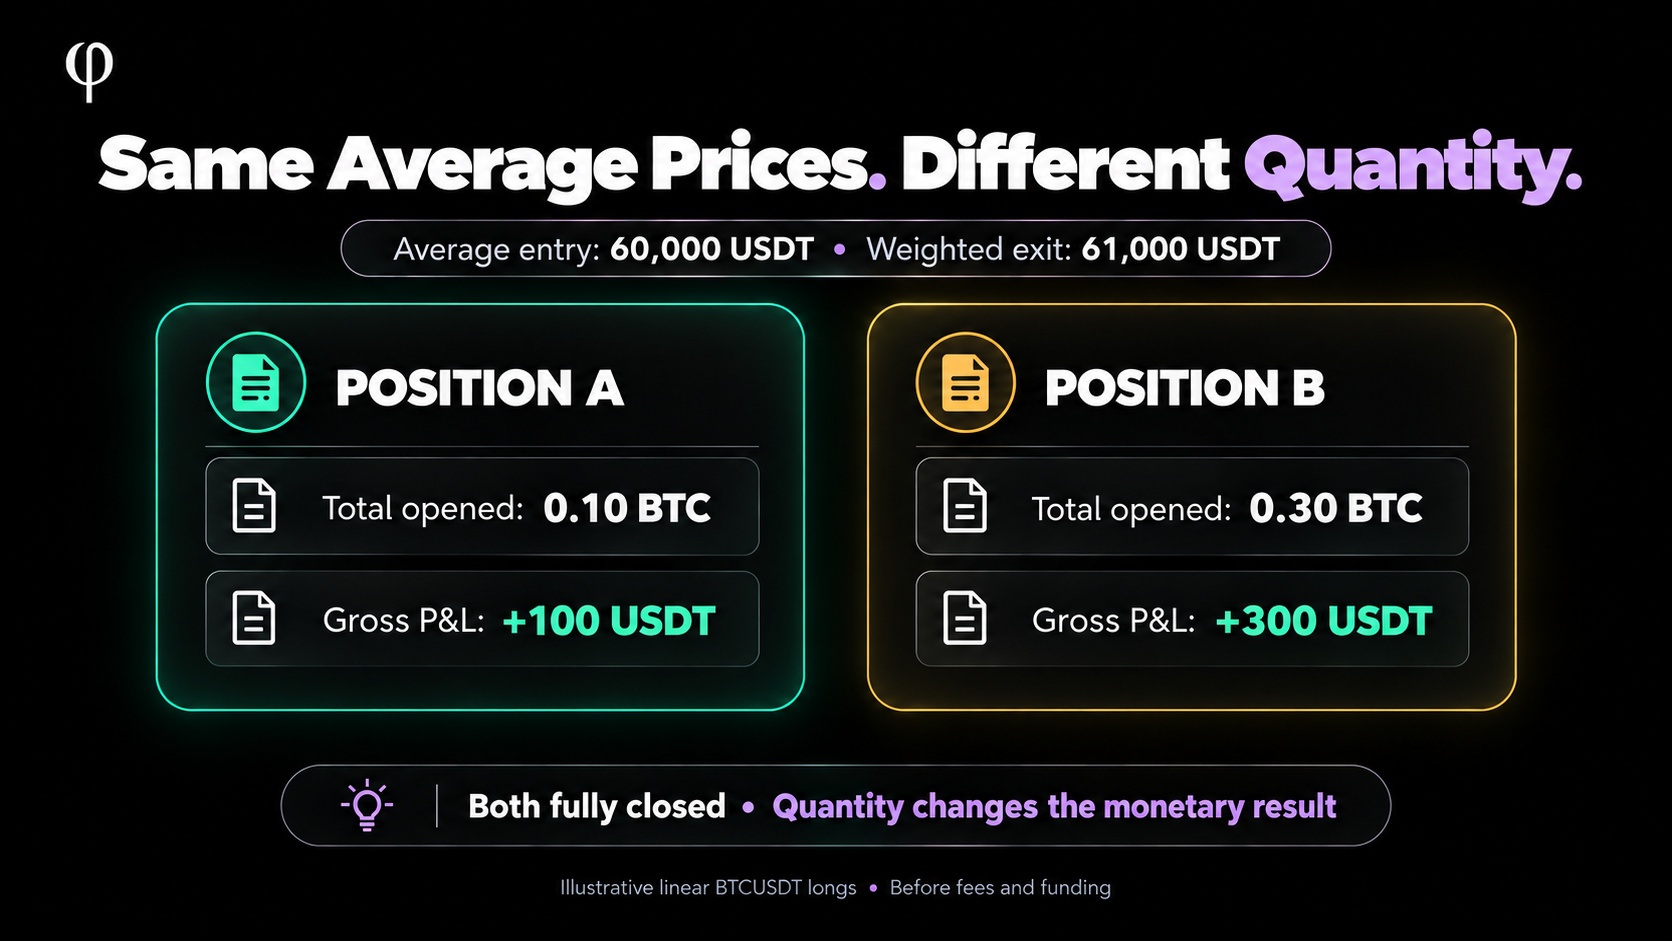
Illustrative linear-contract comparison. Both results are before fees and funding.
6. A Correct Aggregate Still Hides the Sequence
For a fully closed linear long lifecycle, without a reversal or additional settlement adjustment, total opening quantity equals total closing quantity. Quantity-weighted opening and closing averages can therefore reproduce the gross price result:
Gross lifecycle P&L = total opened quantity ×
                      (weighted closing price − weighted opening price)

Position B: 0.30 × (61,000 − 60,000) = +300 USDT
This remains a useful reconciliation even when the lifecycle contains several adds and reductions, provided the grouping and complete execution records support it.
What the aggregate loses is the order and timing of those changes. It does not show whether the larger quantity was held for minutes or days, or how much remained after each close.
Keep the summary for accounting and the timeline for understanding the path. Our guide to reconstructing a closed futures position explains how to build the execution ledger behind that review.
7. Exposure Depends on the Quantity Open at the Time
Position B did not carry 0.30 BTC from beginning to end. It began at 0.10, increased to 0.30, then reduced to 0.10 before closing.
For an open linear position, the same 1,000 USDT price move per BTC corresponds to a 100 USDT gross P&L change at 0.10 BTC and 300 USDT at 0.30 BTC, before other effects.
That sensitivity belongs to the quantity open during the move. A review that applies peak size to the whole holding period can exaggerate earlier exposure. A review that uses only initial size can understate exposure after the add.
For more on the change itself, see What Happens When You Add to a Futures Position?.
The final average entry can stay unchanged while exposure changes substantially. Track quantity alongside price.
8. Holding Time Can Matter Without Changing the Endpoints
Two positions can open and close at the same prices while remaining open for different lengths of time.
Time alone does not determine a funding cost. The relevant settlement events, exposure present at those times, and recorded payments or receipts matter. A short holding period can cross a funding event; a longer period can encounter different rates or payments in different directions.
Use actual cash-flow records when available. Avoid reconstructing a historical bill by multiplying today's displayed rate by the number of hours the position was open.
Binance's Income History documentation distinguishes funding, commissions, realized P&L, and transfers. Those categories help separate costs from unrelated account movements.
Read Where Did My Futures Funding Fee Go? for the relationship between funding and the final result.
9. Gross Price Profit Is Not the Net Result
Now assume Position B's complete ledger shows 24 USDT of trading fees paid and a net 16 USDT funding payment. These are illustrative totals, not a quoted exchange fee tier or funding rate.
Gross position P&L       +300 USDT
Trading fees paid         −24 USDT
Net funding paid          −16 USDT
---------------------------------
Net lifecycle result     +260 USDT
The entry and weighted exit have not changed. The money retained after these stated costs is lower than gross price profit.
Check what your starting P&L field includes. Bybit's USDT contract P&L guide describes cost treatment in its closed result. Subtracting costs from an already net figure would count them twice.
Keep fee currencies visible. If a fee was paid in another asset, any reporting-currency conversion needs a stated valuation method. It should not silently become a same-currency number.
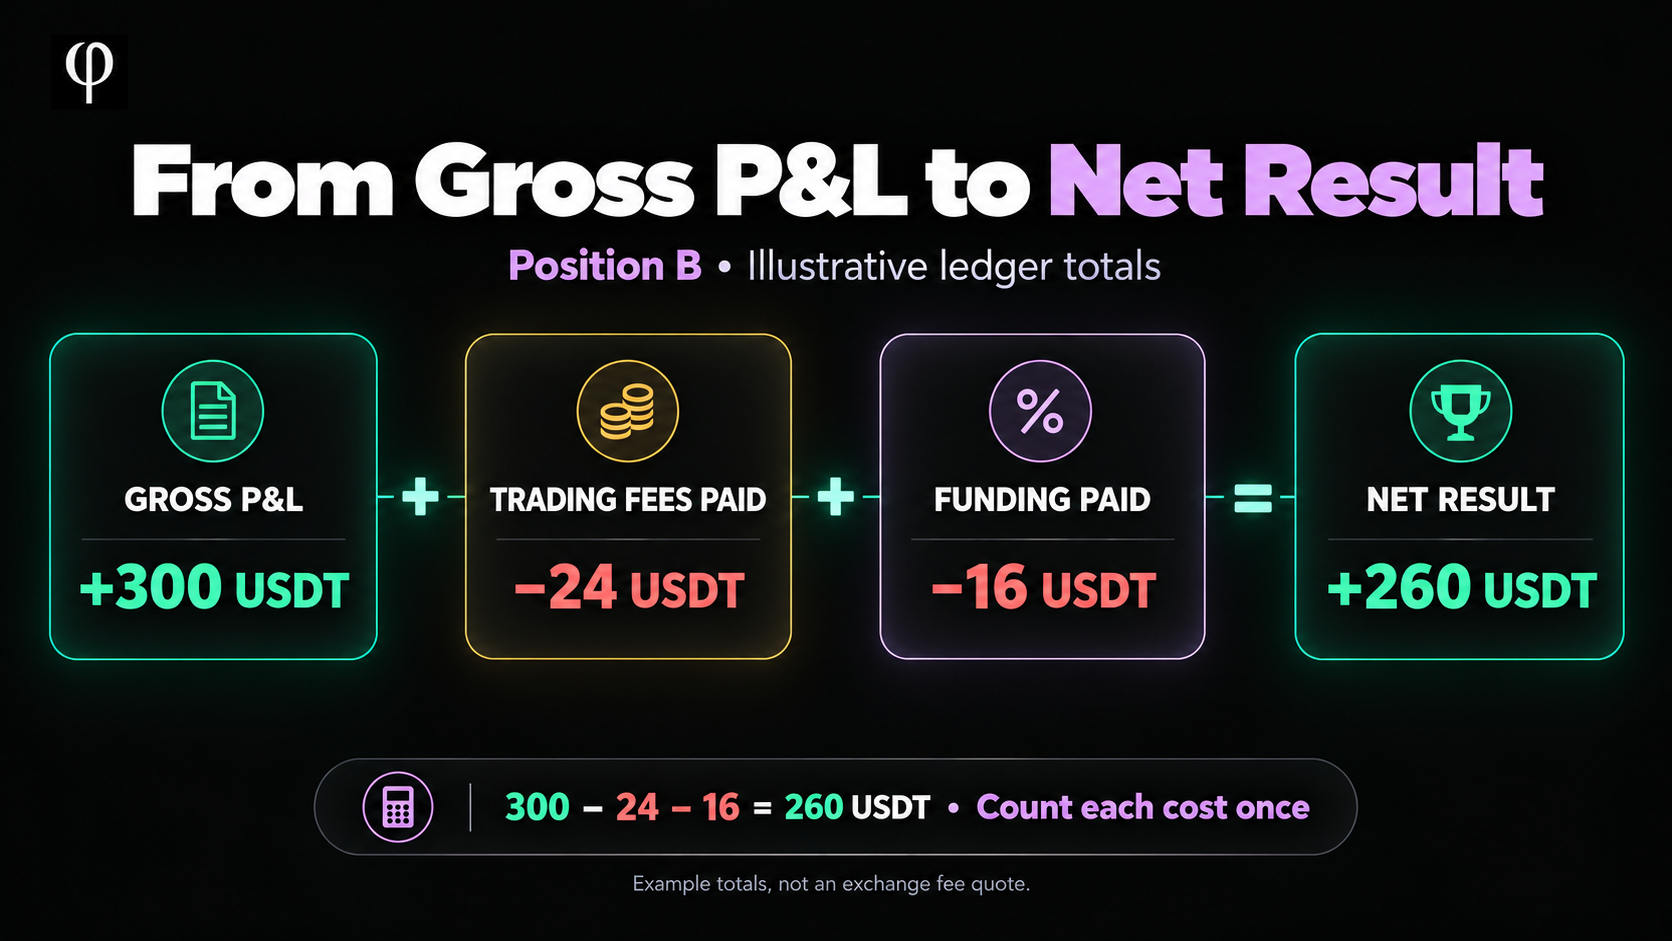
This reconciliation starts with gross position P&L and counts the stated costs once.
10. A Price Summary Does Not Establish Protection
Entry and exit prices cannot tell you whether a stop was present throughout the lifecycle, whether it covered the full remaining quantity, or whether it was amended after an add.
Those questions need historical protection or order evidence. A later stop setting should not be copied backward across the entire position without supporting records.
Even a confirmed stop does not establish a guaranteed maximum loss. Trigger conditions, execution, slippage, liquidation, and account conditions can affect what actually happens.
For the evidence difference between fills and other position changes, read Trade History vs Position History: What's Missing?. It explains which parts can be calculated from executions and which require additional history.
When protection history is unavailable, keep that limitation in the review. A profitable close does not fill the gap.
11. Leverage and ROI Need Their Own Definitions
A leverage label does not replace quantity in the linear gross P&L calculation.
If a position has the same quantity and the same entry and closing executions, changing its leverage setting does not simply multiply the gross price profit. Margin requirements and percentage-return displays can change for reasons that require their own definitions.
Before comparing ROI across positions, identify the denominator and whether costs are included. A percentage based on allocated position margin is not automatically a return on the whole account.
The historical leverage setting also needs evidence. Seeing a current value does not establish which value applied when the position opened or when it grew.
See Why Changing Leverage Doesn't Always Change Risk the Way You Expect for more context.
12. Endpoints Cannot Measure the Worst Point Along the Way
A positive final result does not establish how far unrealized P&L moved against the position before it closed.
Measuring that path requires appropriately timed market-price observations, the quantity open at each observation, the accounting model, and any realized portions already taken. A chart of the underlying asset alone cannot automatically measure the changing position's drawdown.
Keep stop-based hypothetical loss, unrealized P&L, and account-equity drawdown separate. They answer different questions.
Our worked example supplies executions and illustrative costs, but no continuous price history or account-equity series. It therefore supports neither a measured maximum adverse excursion nor an exact peak account drawdown.
Avoid adding a precise-looking historical risk number just because the final entry and exit are known.
13. The Rest of the Account Can Change the Context
A position's price result belongs to that position. The account may also contain other open exposures, cash flows, and collateral changes during the same period.
This matters when interpreting how much of the account was committed or exposed at a particular moment. Position size alone cannot establish a historical account-risk percentage without the relevant account evidence and calculation rules.
Use contemporaneous account records where available. Do not divide a past position result by today's balance and present it as the account's original return or risk.
For the wider relationship, see How Much of Your Account Is at Risk Across Open Futures Positions?.
A useful review can explain the position result while acknowledging that part of its surrounding account history is missing.
14. A Good Outcome Cannot Verify an Earlier Plan
Suppose Position B's final 260 USDT net result looks attractive. That amount does not establish whether the add was planned, whether its larger exposure stayed within a limit, or whether the partial close followed a stated rule.
To answer those questions, compare the timeline with a plan recorded at the relevant time. Keep the plan, observed events, and later interpretation distinguishable.
A position can finish profitably after departing from a plan. A losing position can follow a plan. Neither conclusion should be assigned from the outcome alone.
When no reliable prior plan exists, you can still document the executions and supported context. Label adherence as undetermined rather than inventing an intention after seeing the result.
15. Read a Position Report in Three Layers
Start with the financial summary: contract, side, completed quantity, defined entry and exit averages, gross P&L, costs, and net result.
Then inspect the event timeline: when size increased, when portions closed, and which historically supported protection or settings changes occurred while exposure remained open.
Finally, inspect coverage: whether the opening and final close are confirmed, whether all required records are present, and which observations are missing or calculated under assumptions.
These layers let you use a compact summary without mistaking it for complete historical evidence. They also help explain discrepancies between an exchange's order-level record and a separate lifecycle review.
Retain execution identifiers and source references so a confusing average can be traced back to the quantities that produced it.
16. Questions to Ask Before Drawing a Conclusion
Use these questions when a price summary seems too simple for the position you remember:
- Is the entry a first fill, a remaining-position average, or a full-lifecycle opening average?
- Is the exit the last fill or a weighted average across all closing quantity?
- Which quantity belongs in the calculation, and is the lifecycle fully closed?
- Did adds or partial closes change exposure during the holding period?
- Does the displayed P&L already include trading and funding costs?
- Which protection, settings, account, and price-path records actually exist?
- What can the evidence establish, and what remains unknown?
If the gross total disagrees, reconcile grouping and execution records first. If the number agrees but the story remains incomplete, inspect the supported timeline and context. They are different review problems and need different evidence.
A Better Question to Ask
Instead of asking only “Did I exit above my entry?”, ask:
What quantity did I carry, when did it change, how was it closed, and what remained after the recorded costs?
Then ask which parts of the exposure and protection history you can verify. This turns a pair of price fields into a starting point for a more useful review.
The Bottom Line
Entry and exit prices can summarize a price result when their definitions and quantity are correct. They cannot establish the full sequence or context of a futures position.
In Position B, the last exit at entry contributed zero gross P&L, while an earlier partial close produced 300 USDT. The weighted exit reconciled that gross result, and the illustrative cost ledger reduced it to 260 USDT net.
Keep the accounting summary accurate, the timeline traceable, and missing evidence visible. Understanding the position requires all three.
See the Full Story
Fibonomy is a read-only Trading Clarity Platform for understanding positions and their account context. Its public preview illustrates position changes and account exposure. It does not execute trades or provide trading signals.
See the full story in Fibonomy.
Available historical coverage depends on the underlying records and supported product behavior. Connecting an account is not a promise that every past setting, order amendment, or market-price observation can be recovered.
This article is educational and is not financial advice. All numerical examples are illustrative. Contract models, settlement rules, and P&L definitions can differ. Historical protection does not guarantee execution or establish a maximum possible loss.
Official Sources
- Bybit USDT Contract P&L Calculations
- Bybit Inverse Contract P&L Calculations
- Bybit Get Trade History
- Bybit Get Closed PnL
- Binance USDⓈ-M Income History
Sources checked October 15, 2026.