October 31, 2026Position Reconstruction
Realized P&L vs Position History: Why the Numbers Don't Match
Realized P&L and position history can measure different scopes. Reconcile gross results, incurred costs and partial-close allocations with a worked example.
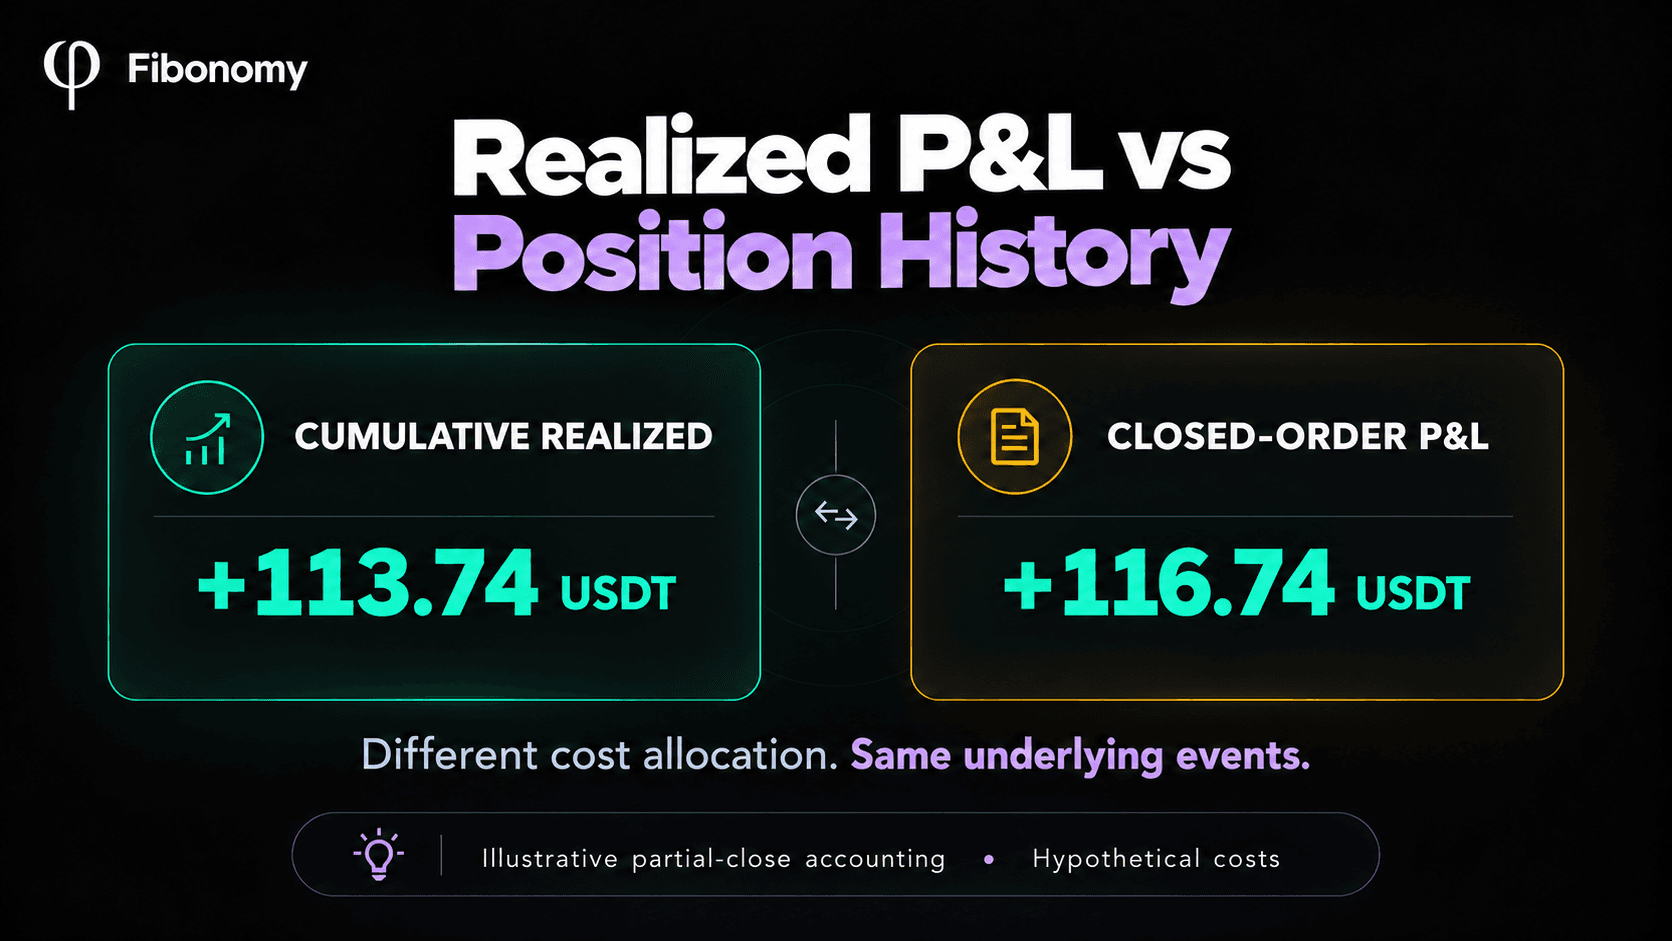
Your position history shows a profitable closing event, but the realized P&L field shows a smaller number. Another closing report gives a third result.
Before treating the difference as missing profit, check what each figure includes.
Realized P&L and position history can disagree because they cover different quantities, periods, costs or events. A position history may show gross closing results, while a realized field includes fees and funding already charged. After a partial close, an allocated closed-order result can also differ from the cumulative realized result of the still-open position.
The task is to reconcile the same events under the same definition. This guide shows how to do that with a complete numerical example.
What are you actually comparing?
A realized P&L field is a calculated result. Position history is a record of events or position lifecycles whose displayed totals depend on the product presenting it. Neither label is a universal accounting standard.
| View or field | Useful for | Check before comparing |
|---|---|---|
| Execution history | What quantity filled, at what price and fee | Filled quantity rather than requested order quantity |
| Gross closed trading result | Price-based gain or loss on completed reductions | Whether costs are excluded |
| Cumulative realized position P&L | Realized components attributed to the position so far | Included costs and when the accumulation resets |
| Closed-order P&L | Result associated with a closing record | Allocation of opening costs and funding |
| Current unrealized P&L | Current marked result on the remaining quantity | Price reference and quantity still open |
| Account-period result | Activity within a selected reporting window | Accounts, symbols, currencies and time boundaries |
The same trade can legitimately contribute different amounts to these views. First name the exact field, its scope and its cost treatment.
For the underlying records, see trade history versus position history. This article focuses on reconciling their financial totals rather than choosing a history screen.
Example: why 120, 113.74 and 116.74 USDT can all appear
Consider an illustrative linear BTCUSDT long, using a Bybit-style distinction between cumulative realized P&L and an allocated closed-order result.
The position opens with 0.10 BTC at 60,000 USDT per BTC. An opening fee of 3 USDT is charged. While it is open, 2 USDT of funding is paid. Later, 0.04 BTC closes at 63,000 USDT, with a closing fee of 1.26 USDT. The remaining 0.06 BTC stays open.
The fees are hypothetical teaching amounts, not current exchange quotations. There are no other positions, additions, rebates or costs in this example.
The closing event's gross trading result is:
0.04 x (63,000 - 60,000) = +120 USDT
If a position timeline labels that event with its gross result, +120 USDT describes price P&L on the completed reduction. It is not necessarily the net realized field.
For the cumulative position-period calculation, include the entire opening fee and the funding already paid, plus the closing fee:
Gross closed trading result: +120.00 USDT
Opening fee already charged:   -3.00 USDT
Funding already paid:          -2.00 USDT
Closing fee:                   -1.26 USDT
Cumulative realized result:  +113.74 USDT
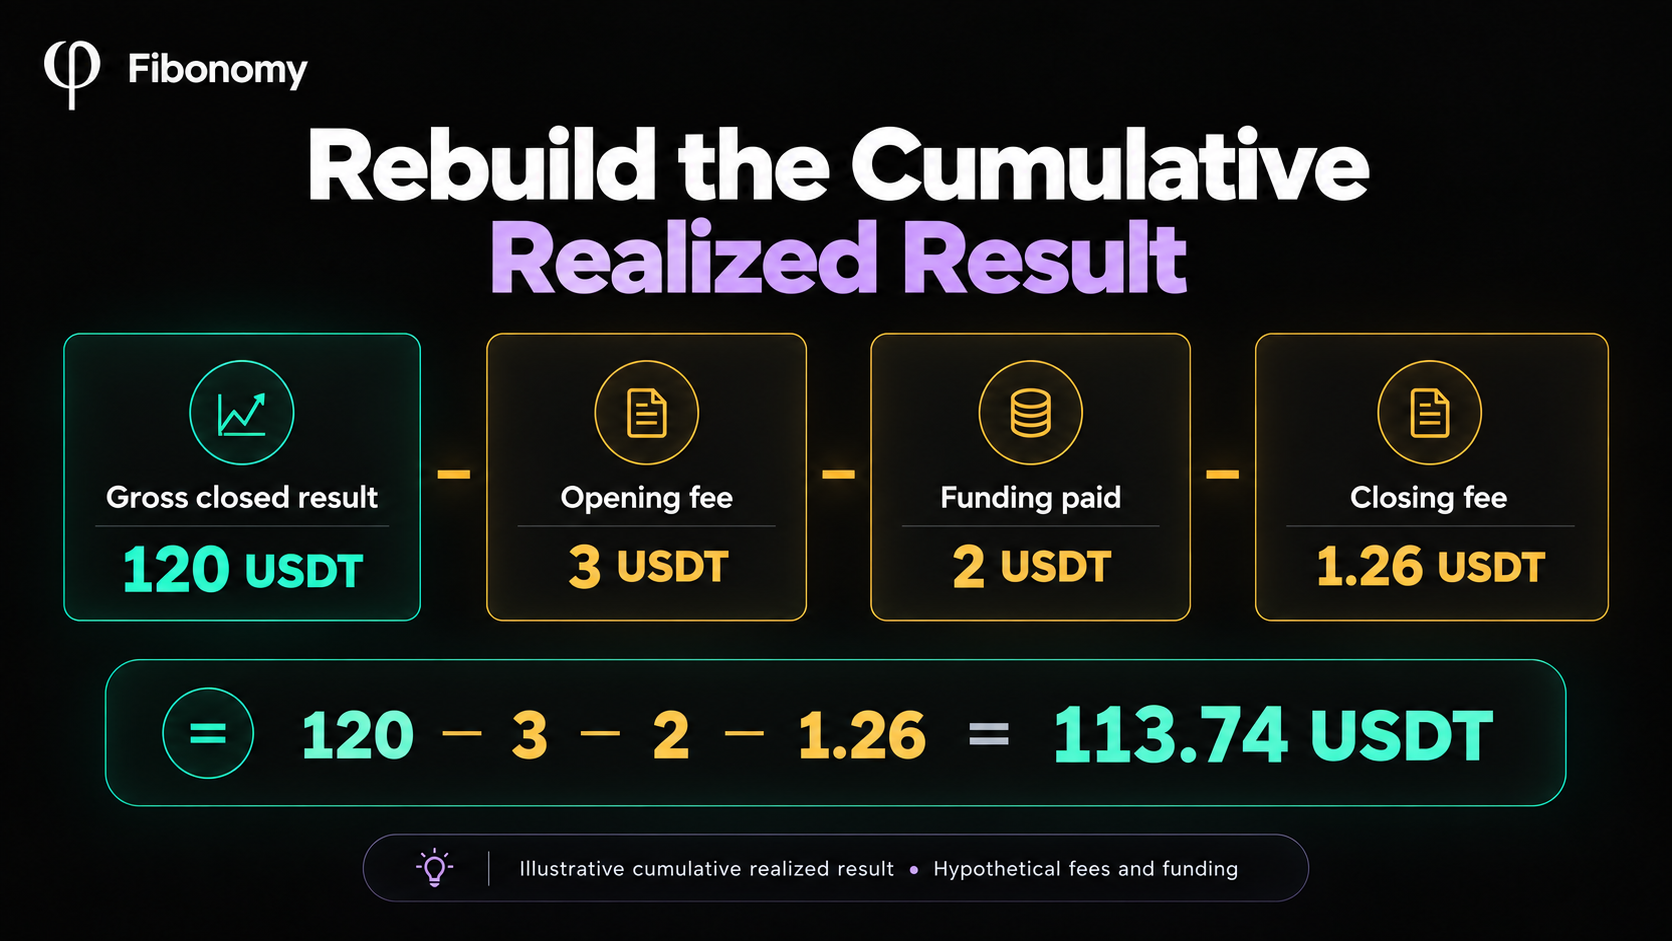
Illustrative cumulative realized position result. Actual fields and fee allocation depend on the exchange.
Now compare a closed-order calculation that allocates opening costs and funding to the 40% of the position closed:
| Component | Cumulative position-period calculation | Allocation to the 40% closed part |
|---|---|---|
| Gross closing result | +120.00 USDT | +120.00 USDT |
| Opening fee | -3.00 USDT | -1.20 USDT |
| Funding paid | -2.00 USDT | -0.80 USDT |
| Closing fee | -1.26 USDT | -1.26 USDT |
| Result | +113.74 USDT | +116.74 USDT |
The allocated result is 120 - 1.20 - 0.80 - 1.26 = 116.74 USDT. The difference is 3 USDT: 1.80 USDT of opening fee plus 1.20 USDT of funding outside the closed-part allocation.
That does not mean a fee was refunded or profit was created. The two calculations assign already-known costs to different scopes.
Bybit's USDT P&L guide documents this distinction: its cumulative realized field includes trading fees, funding and partial-close results, while partial-close closed P&L prorates opening and funding fees. This is the exchange-specific basis for the example, not a rule for every history product.
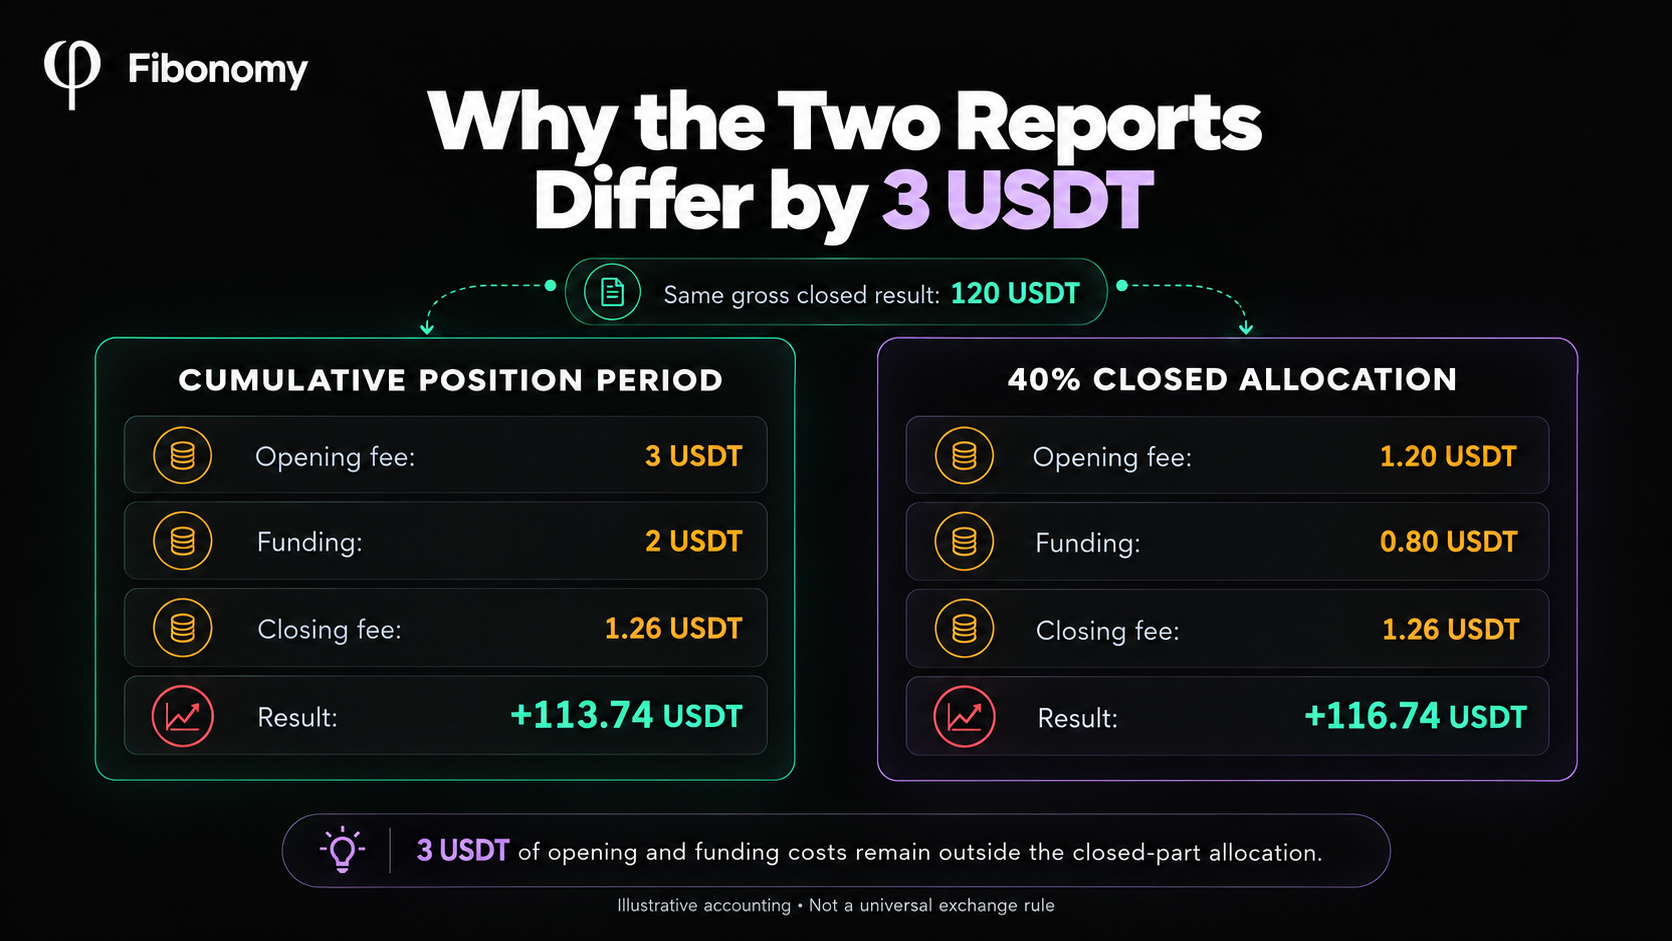
The gross closed result is the same. The opening-fee and funding allocations differ.
Should unrealized P&L be added to the realized figure?
Only when the components cover the same lifecycle and costs are handled consistently. Unrealized P&L belongs to the quantity still open; it is not another completed closing result.
Suppose the remaining 0.06 BTC is valued at 62,500 USDT per BTC, with its original 60,000 USDT entry basis:
Current unrealized P&L:
0.06 x (62,500 - 60,000) = +150 USDT

Marked lifecycle result after incurred costs:
113.74 + 150 = +263.74 USDT
This snapshot includes the modeled costs already incurred. It does not subtract an unincurred future closing fee for the remaining 0.06 BTC, and it is not a final closed-position result.
Do not add both 113.74 and 116.74 to the same total. They are alternative representations of overlapping activity. Also do not add an earlier unrealized snapshot that already included the quantity subsequently closed.
The mechanics are explained further in what changes after a partial futures close.
Why can an account report still differ after costs are matched?
The remaining difference may come from the reporting window or account scope rather than the position arithmetic.
A position opened before the selected date range can have an opening fee outside that range and a closing result inside it. A full-lifecycle reconstruction includes both events; a date-filtered activity report may include only one.
Compare timestamps on the same basis. A local calendar day and a UTC day have different boundaries. Check the actual time filters and how the platform assigns event dates.
Also align the account, subaccount, symbol, settlement asset and position direction. Do not compare one BTCUSDT position with a report combining several contracts, or treat a transfer as profit from a closing fill.
Bybit's transaction-log documentation distinguishes cash flow, funding, fees and balance changes. Those components are useful evidence for reconciliation; a balance change alone is not proof of trading profit.
This explains why a profitable event history can coexist with a lower account result. The broader diagnostic is covered in why futures P&L can be negative despite profitable closed trades.
Which records establish the actual result?
Use executions to establish fills, closing records to inspect the exchange's reported result, and ledger entries to establish charged or received cash flows. Keep their scopes explicit.
Bybit's trade-history API documentation notes that a single order can have several executions and exposes execution-level information. Its closed-P&L documentation provides separate closing records with fields such as closed size and average entry and exit prices.
These record types answer related but different questions. A submitted order price is not evidence of a fill, and an account ledger row is not automatically a complete position lifecycle.
A practical review has five steps:
- Identify the exact position and the start and end of the lifecycle being compared.
- Rebuild executed additions and reductions in order, retaining the open quantity after each event.
- Calculate gross price P&L on the closed quantities using the applicable entry basis.
- Match trading costs and funding, labeling whether they are already netted or allocated.
- Compare like-for-like totals and keep any unexplained residual visible.
Do not force a residual into "fees" merely because that makes the table balance. If records are missing, state what is missing. Do not silently turn an unavailable fee into zero.
For a detailed lifecycle workflow, see how to reconstruct a closed futures position from exchange data.
How do you avoid counting fees or funding twice?
Choose one consistent calculation basis. Either start with gross components and apply the appropriate costs, or start with a correctly scoped net figure and add only components it excludes.
If +113.74 USDT already deducts the modeled opening fee, closing fee and funding, subtracting those amounts again would understate the result.
Similarly, a funding payment shown as a separate ledger entry may already be incorporated into a cumulative realized field. It is useful reconciliation evidence without being another deduction to append automatically.
Review where futures funding fees go in P&L when tracing those entries. Keep paid and received amounts distinct, and check the sign convention of the source field.
| Symptom | Likely comparison to inspect |
|---|---|
| History is higher by incurred costs | Gross event result versus a net realized field |
| Closed-order result exceeds cumulative realized | Opening-cost or funding allocation after a partial close |
| Totals change with date filters | Period activity versus full lifecycle |
| Account result differs from one position | Other contracts, accounts or non-trading balance changes |
| Difference remains unexplained | Missing records, timing, currency or an incorrect field interpretation |
These are starting points for review, not a claim that every discrepancy has the same cause.
The better question: are these numbers measuring the same thing?
Before asking which report is wrong, specify the quantity, period, lifecycle, price basis and included costs.
In the worked example, 120 USDT is the gross closing result, 113.74 USDT is the modeled cumulative realized result, and 116.74 USDT is the allocated closed-part result. Matching definitions resolves the difference without inventing a missing trade.
Fibonomy provides read-only context for changes inside positions and their account effect. It does not execute trades or provide signals. Use the position story alongside the exchange's execution and ledger records.
Frequently asked questions
Why is realized P&L lower than the profit shown in position history?
Check whether the history shows a gross closing result while the realized field includes incurred fees and funding. Then align the period and position scope. A lower number alone does not prove a calculation error.
Can closed P&L differ from realized P&L?
Yes, depending on the exchange's definitions. The Bybit-style partial-close example gives 116.74 USDT allocated closed P&L and 113.74 USDT cumulative realized because costs are attributed differently.
Is current unrealized P&L included in a realized figure?
Do not assume it is. The still-open quantity has a marked result that can change. Read the exact field definition before combining components.
Should I subtract funding from a net realized figure?
Only if that figure excludes the funding you intend to include. Otherwise you may deduct the same cash flow twice.
What if the records still do not reconcile?
Retain the unexplained difference and identify missing executions, costs, time coverage or account scope. Keep event identifiers and timestamps for a reproducible review rather than guessing the cause.
Sources and scope
Primary documentation checked on 1 November 2026:
- Bybit: USDT contract P&L and partial-close allocation.
- Bybit API: trade history and executions.
- Bybit API: closed P&L records.
- Bybit API: account transaction log.
All amounts are original hypothetical examples. The allocation example follows the stated exchange documentation; other platforms, contract types and reporting fields may differ. The marked lifecycle result is a snapshot after incurred costs, not a final exit guarantee.