October 31, 2026Position & Account Risk
Is Moving Your Stop to Entry Really Break Even in Futures?
A stop at entry can leave a net loss after fees, funding and execution differences. Separate entry price, break-even estimates and actual fills with a clear example.
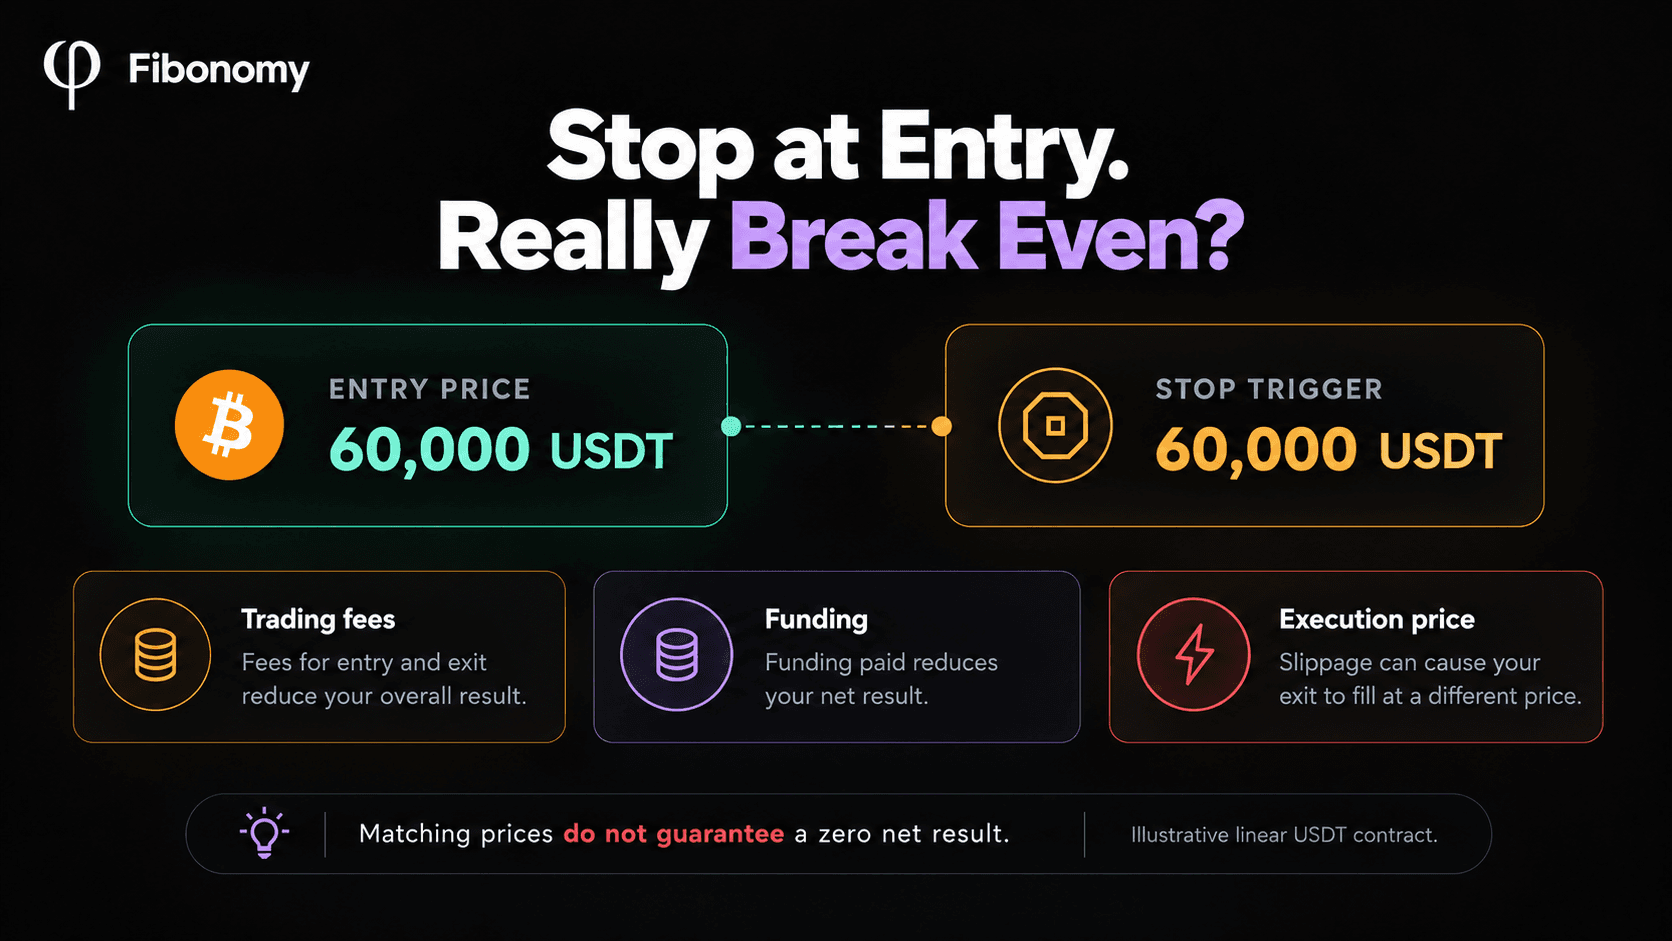
You move a profitable futures position's stop to its entry price. The order now looks like a break-even stop.
But matching the entry price is only one part of the result.
Moving a futures stop to entry does not guarantee a break-even trade. An actual exit at entry produces zero gross price P&L for a simple unchanged position, but trading fees and net funding can still leave a loss. The stop's trigger price also does not guarantee the price at which the exit fills.
To review the decision clearly, separate three things: entry price, the price that activates the stop, and the net result after execution and costs.
What does a break-even stop actually mean?
Traders often use "break-even stop" to mean a stop placed at the entry price. A cost-adjusted break-even calculation asks a different question: at what actual exit price would the included gains and costs sum to zero?
| Term | What it describes | What it does not establish |
|---|---|---|
| Average entry price | The entry basis of the current position | An exit price that covers every cost |
| Stop trigger price | The reference-price condition that activates an order | The average price of the eventual fills |
| Average exit fill | The quantity-weighted price of completed closing executions | Whether all trading and funding costs are covered |
| Cost-adjusted break-even estimate | A calculated exit price for zero net result under stated assumptions | Guaranteed execution or a universal exchange field |
| Final net result | The realized outcome for a defined scope after applicable costs | The result of another position or reporting period |
Bybit's P&L FAQ, for example, describes its break-even price in terms of opening and closing trading fees. Do not assume that a displayed break-even field includes every funding payment or the same adjustments as your own lifecycle calculation.
The distinction matters because entry and exit prices leave out parts of the position story. A familiar label cannot replace a check of what the number includes.
Can exiting exactly at entry still produce a loss?
Yes. In the illustrative account below, gross price P&L is zero, but trading fees and funding produce an 8 USDT net loss.
Assume one linear BTCUSDT long with no additions or earlier reductions:
- Position quantity: 0.10 BTC.
- Entry and actual exit price: 60,000 USDT per BTC.
- Illustrative opening fee: 0.05% of opening notional.
- Illustrative closing fee: 0.05% of closing notional.
- Net funding paid over the holding period: 2 USDT.
- No other charges, rebates or settlement adjustments.
The 0.05% rate is a teaching assumption, not a statement of any exchange's current fee schedule. Use your own fills and applicable fees for a real reconciliation.
| Component | Calculation | Result |
|---|---|---|
| Gross price P&L | 0.10 x (60,000 - 60,000) | 0 USDT |
| Opening fee | 0.10 x 60,000 x 0.0005 | 3 USDT paid |
| Closing fee | 0.10 x 60,000 x 0.0005 | 3 USDT paid |
| Net funding | Assumed holding-period payment | 2 USDT paid |
| Net result | 0 - 3 - 3 - 2 | -8 USDT |
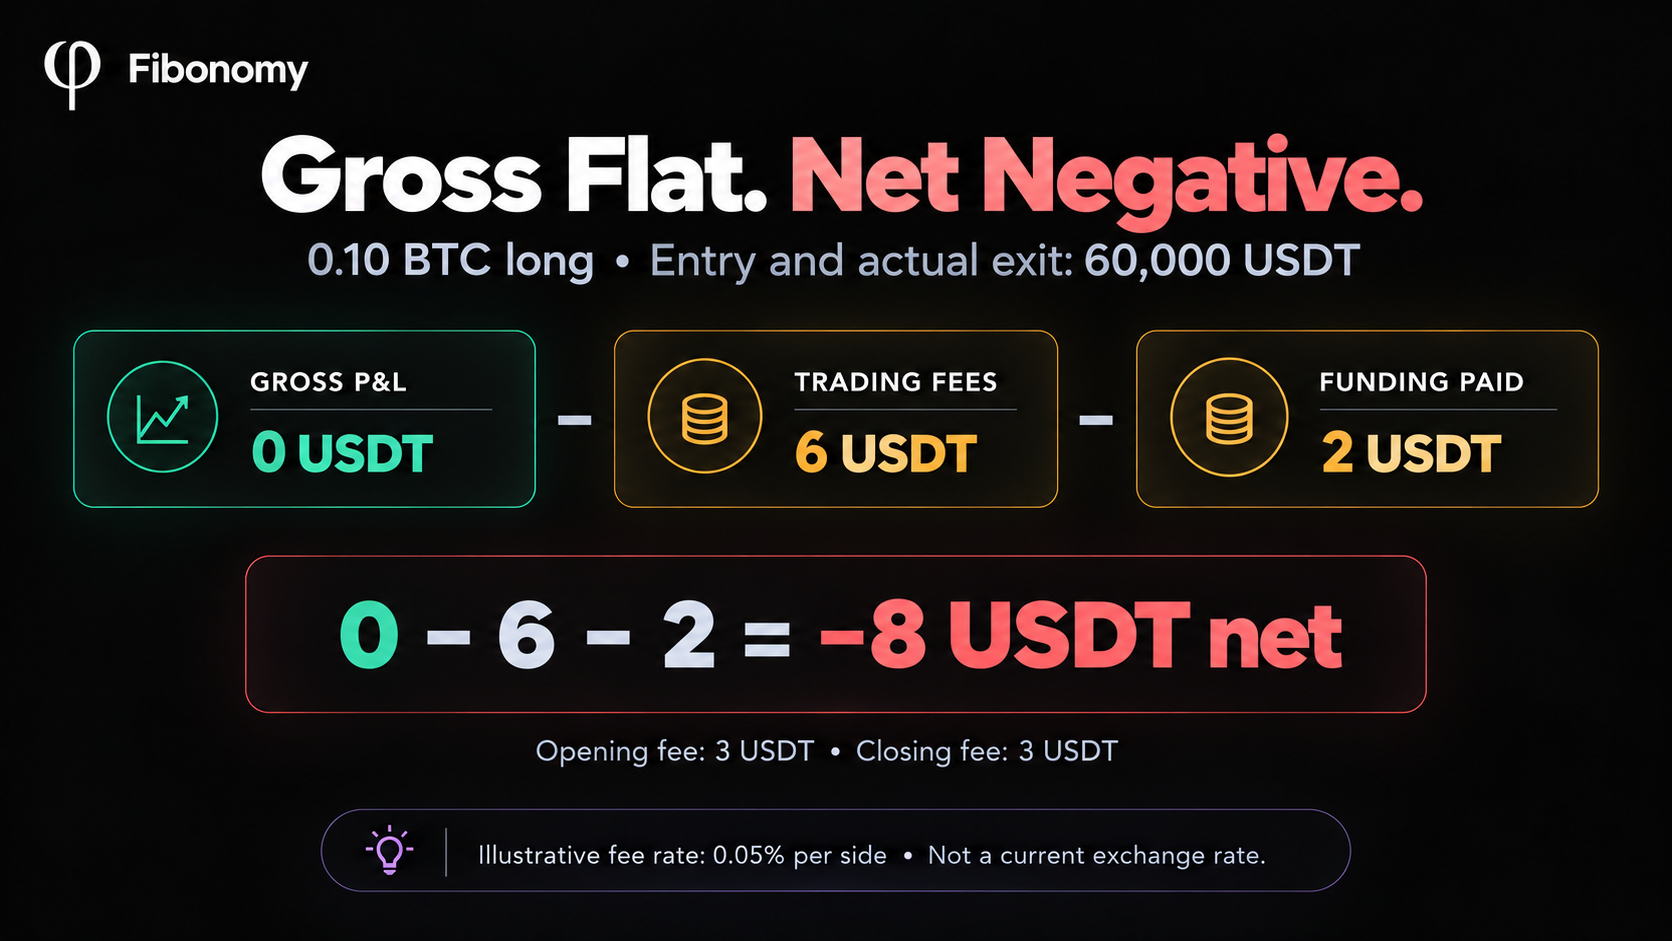
Illustrative 0.10 BTC linear long. Both actual prices are 60,000 USDT; the assumed fee rate is 0.05% per side.
The price round trip is flat. The cash-flow result is not.
For an exchange-specific comparison, Bybit's USDT contract P&L guide separates price-based unrealized P&L from closed results that include fees and funding. That distinction explains why an open-position display and a final closing record may disagree without either being an error.
Use the actual settled funding amount, including its direction. Funding received can offset costs; funding paid adds to them. The dedicated guide to how funding fees affect futures P&L explains that cash-flow review.
How do you calculate a cost-adjusted break-even exit price?
For a simple unchanged linear long, solve for the actual exit price at which price P&L covers the opening fee, closing fee and net funding included in the model.
Define:
| Symbol | Meaning | Unit |
|---|---|---|
| Q | Position quantity | BTC |
| E | Average entry price | USDT per BTC |
| P | Actual average exit price being modeled | USDT per BTC |
| fo | Opening fee rate | Decimal |
| fc | Closing fee rate | Decimal |
| F | Net funding paid; negative if received | USDT |
Under these assumptions:
Net result = Q x (P - E) - Q x E x fo - Q x P x fc - F

Setting net result to zero:

P = [Q x E x (1 + fo) + F] / [Q x (1 - fc)]
The exit fee depends on the exit notional, so it changes slightly as P changes. Dividing an estimated total cost by quantity gives a useful rough adjustment, but solving the equation keeps that dependency explicit.
Using the example's numbers:
Q = 0.10
E = 60,000
fo = fc = 0.0005
F = 2

P = [0.10 x 60,000 x 1.0005 + 2] / [0.10 x 0.9995]
P = 6,005 / 0.09995
P is approximately 60,080.04 USDT per BTC
With trading fees alone and no funding, the same model gives approximately 60,060.03 USDT per BTC. Including the assumed 2 USDT funding payment raises the modeled price to approximately 60,080.04.
These are rounded calculation results, not executable price recommendations. Actual tick sizes, fee rounding, fills and later funding may change the result. Neither number is a guaranteed net-zero stop trigger.
This formula is our original teaching derivation for the stated linear long. Do not apply it unchanged to inverse contracts, shorts, positions with partial closes, or accounting that resets the entry basis.
Why can a stop at entry fill below entry?
The trigger is an instruction condition; the fill is an execution outcome. They can differ.
Suppose the illustrative long first moves above its 60,000 USDT entry. A stop is then active with a 60,000 USDT trigger. Later, it activates and the closing executions average 59,980 USDT.
Stop trigger: 60,000 USDT
Actual average exit: 59,980 USDT

Gross price P&L:
0.10 x (59,980 - 60,000) = -2 USDT
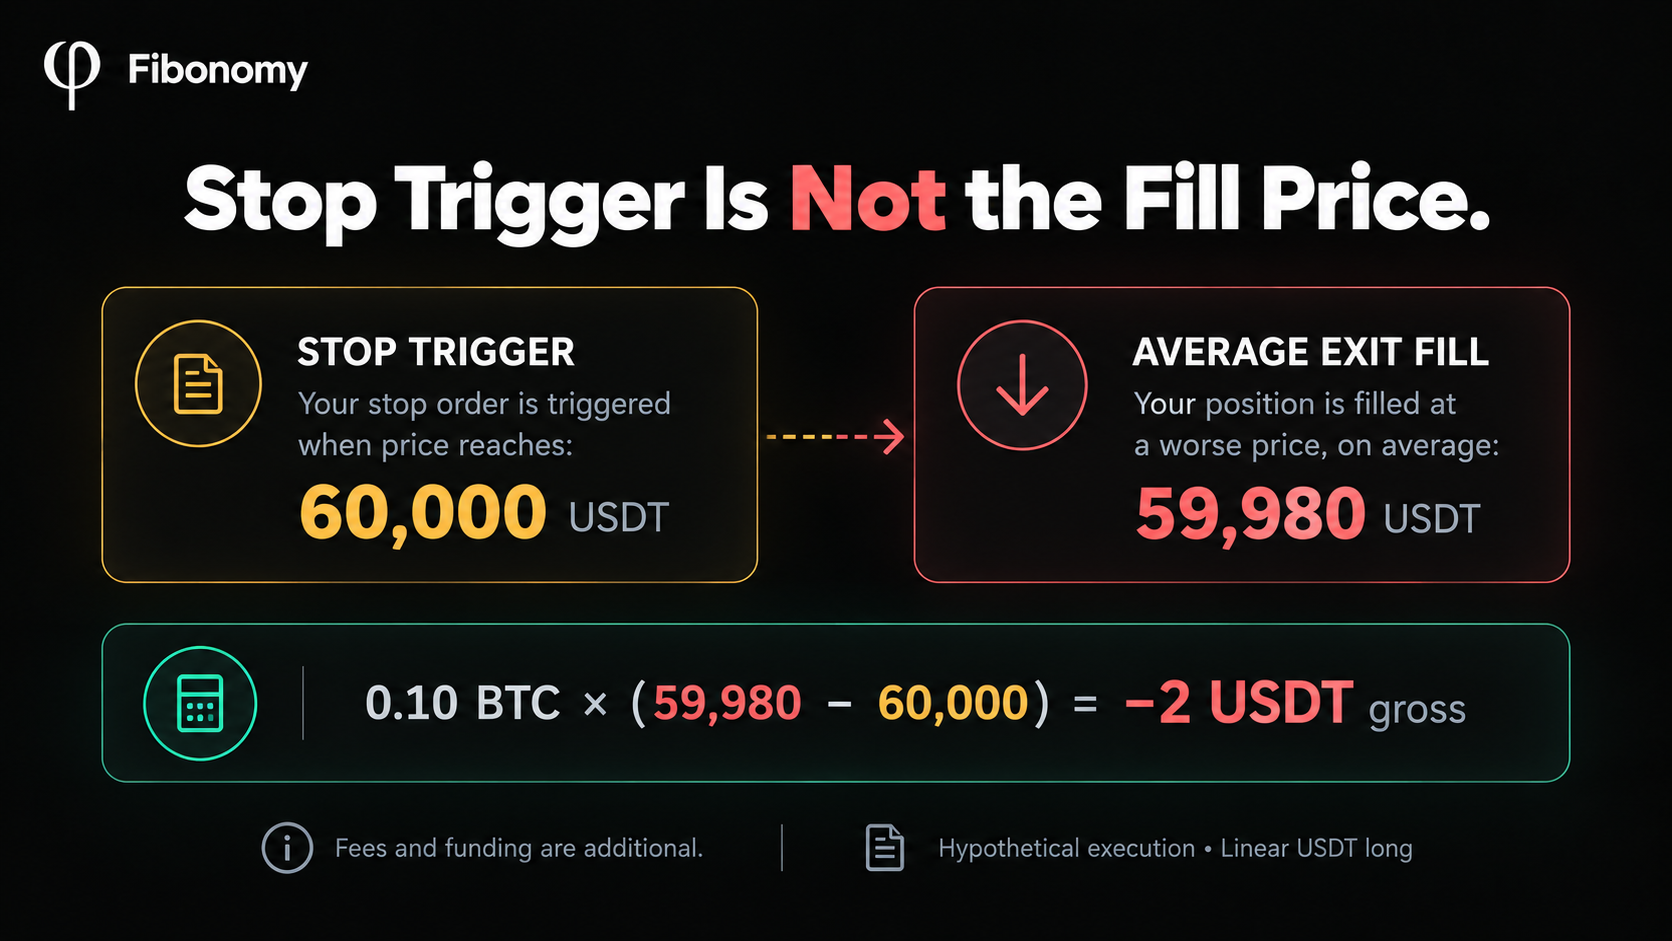
Hypothetical execution, not a prediction. Trading fees and funding are additional.
There is now a gross price loss before costs. Compare completed executions with the trigger setting rather than treating the setting as proof of the exit price.
Bybit's order-type guide explains that market execution can experience slippage. Its conditional-order and limit-order descriptions also distinguish activating an order from matching it. A price-constrained order can remain unfilled; it is not an automatic guarantee of a completed exit.
Check which price reference activates the stop and which order is placed afterward. The stop-trigger process and liquidation process also need separate review, as discussed in why a futures position can be liquidated despite a stop loss.
Does changing leverage remove the cost of a break-even exit?
Changing a leverage setting does not erase the closing quantity, the executed prices or costs already incurred. In this model, the net-result equation uses quantity, prices, fees and funding; a leverage multiplier is not added to price P&L.
Keep the two measurements separate: a margin-based return percentage and a result in USDT. A percentage can change when its denominator changes even though it does not refund a trading fee.
For a fuller distinction, see what changing leverage in futures actually changes.
The question here is whether the included cash flows sum to zero for a defined quantity. A different displayed return percentage does not answer that question.
What if you already took partial profit?
Then distinguish break-even on the remaining position from break-even on the whole position lifecycle. They need not be the same price.
A prior realized gain can offset a later loss on the remainder. Conversely, a profitable-looking remaining exit can still leave the full lifecycle negative after earlier results and costs.
Start with the recorded realized component, the remaining quantity and its entry basis. Add the projected result on that remaining quantity with a consistent treatment of costs. Do not charge the full original opening fee twice, and do not count the pre-close unrealized snapshot as another gain.
The worked example in what happens when you partially close a futures position shows how realized and current unrealized components fit together.
This article's 60,080.04 USDT estimate assumes no prior reductions. It should not be carried over to a reduced position without rebuilding the calculation.
What should you check before calling a position break-even?
Check the scope of the result, the costs included and the order that would actually close the exposure.
| Check | Evidence to use |
|---|---|
| Which result are you trying to make zero? | Remaining position, full lifecycle or account-period result |
| What quantity is still open? | Current position state and executed reductions |
| Which entry basis applies? | Contract and exchange accounting for that position |
| What fees have already been paid? | Execution records and account ledger |
| What closing fee is being assumed? | Actual applicable fee rate and projected closing notional |
| Is funding paid or received? | Settled ledger entries and any explicitly labeled future estimate |
| What activates the stop? | Selected trigger reference and trigger price |
| How does the exit execute? | Market or price-constrained instruction, covered quantity and status |
Bybit's fee structure documentation notes that applicable rates depend on factors including account tier and region, and directs users to their own fee-rate page. A generic example should not be substituted for your rate.
Keep observed costs separate from future assumptions. If more funding may accrue before the exit, today's estimate can change. If part of the stop fills and part remains open, the final result is not established yet.
Finally, a cost-adjusted exit estimate is not a complete account risk assessment. Other positions and shared resources can still matter. Review crypto futures account risk alongside the individual position.
The better question: what result would this exit actually leave?
Rather than relying on the phrase "stop at break-even," identify the modeled net result, the remaining uncertainty and the protection that is actually active.
An entry-price stop may change the planned exit compared with an earlier stop. It does not certify a zero-cost outcome, a completed execution or a risk-free account.
Fibonomy provides read-only context for changes in position size, leverage and protection. It does not provide trading signals or execute orders. Use that context alongside the exchange's fills and ledger to understand what changed and what remains exposed.
Frequently asked questions
Is a stop at entry the same as break-even?
Only under a narrowly defined gross-price comparison with a matching actual exit and entry basis. Fees, funding and different execution prices can make the net result negative.
Why did I lose money when the entry and exit prices match?
The gross price result can be zero while the net result includes costs. In the illustrative 0.10 BTC trade, 6 USDT in trading fees and 2 USDT in funding produce an 8 USDT net loss.
Does a displayed break-even price include funding?
Check the exchange's definition. Bybit's FAQ describes its break-even price in terms of opening and closing trading fees; that description alone does not establish that your full funding history is included.
Can a stop at the calculated break-even price guarantee no loss?
No. A calculated exit price is conditional on the model's inputs. Triggering, fill prices, rounding and later costs can produce a different result.
When should I move a stop to entry?
This guide does not prescribe a universal timing rule. Review the trading plan, remaining exposure, actual order behavior and account risk. A zero-net-result calculation alone does not determine whether changing the stop fits the plan.
Sources and scope
Official documentation checked on 31 October 2026:
- Bybit: P&L FAQ and the scope of its break-even field.
- Bybit: USDT perpetual and expiry contract P&L calculations.
- Bybit: order types and execution.
- Bybit: trading fee structure.
The figures and diagrams are original simplified examples of an unchanged linear USDT long. Prices and fee rates are hypothetical. Net funding paid is a stated input. The equation is not a universal exchange formula, a current fee quotation or a guaranteed execution level.